
Apparently, riding a motorcycle now makes you impotent. If you're 50 years or older and ride a motorcycle you are basically guaranteed to have erectile problems (93%). I find the statistics pretty unlikely, but even if they're true I reckon it's more likely that men who've lost interest in sex go out an buy themselves motorcycles to keep themselves entertained.
23 November 2008
7 March 2008
Age groups by number of children
I think this is way cool. I'm really curious about the 80-84 age group. For some reason hardly any of them have three children. A lot had two kids, and a lot had four or more, but only a few had three. My hypothesis is that those mothers are all strong Anglicans or Catholics. All the Anglicans had 2, and all the Catholics had 4+.
Age     Birth       Women by number of children ever born
group   cohort      (%)
                    0       1       2       3       4+
15–19  1982–86    97.6    2.2     0.1     0.1     0.0
20–24  1977–81    83.2    9.6     5.8     1.1     0.0
25–29  1972–76    58.1    18.8    13.6    5.3     0.3
30–34  1967–71    33.2    22.2    25.1    13.5    4.2
35–39  1962–66    15.9    13.4    36.1    22.0    6.0
40–44  1957–61    14.0    12.4    36.2    22.4    12.6
45–49  1952–56    10.7    14.2    36.3    25.2    15.0
50–54  1947–51    8.1     9.4     40.2    26.1    13.6
55–59  1942–46    6.6     6.7     37.2    27.5    16.2
60–64  1937–41    7.5     6.7     29.0    24.4    22.0
65–69  1932–36    5.4     8.4     20.9    27.7    37.6
70–74  1927–31    5.8     8.9     26.1    25.5    31.6
75–79  1922–26    8.4     10.4    30.0    20.3    30.9
80–84  1917–21    5.0     11.5    30.6    17.3    35.6
85–89  1912–16    13.4    8.6     27.5    23.7    26.7
90–94  1907–11    3.7     4.9     31.4    36.2    23.8
Source: Australia's fertility: a HILDA survey based analysis
2 September 2007
Irrational Traders
By convention, irrational traders and non-traders (participants who always chose the no cost option) were excluded prior to analysis.
Discrete Choice Experiment to Derive Willingness To Pay for Methyl Aminolevulinate Photodynamic Therapy Versus Simple Excision Surgery in Basal Cell Carcinoma
This is the sort of that often happens in discrete choice experiments. People whose decisions don't fit in with their assumptions are not considered worth including. In this case, people who always prefer to save money in making health care decisions (for skin cancer) are totally ignored. Those people are probably also the poorest, who may seem irrational or stubborn to comfortably off researchers, but most likely reflect the reality of not having much money. I can imagine someone conducting research on health care preferences of the uninsured and ignoring everyone whose decisions are dominated by cost.
The researchers will argue that they aren't interested in the poor and that they just want to get a general idea of what's going on. But when ignoring certain results is this arbitrary it becomes very easy to remove stuff for the wrong reasons. And when certain social groups are systematically excluded like this it's a bit troubling.
22 June 2007
Calculating a Bond Yield
> f = function(y) (5/(1+y) + 5/((1+y)^2) + 105/((1+y)^3) - 88)^2
> optimize(f, c(0,1))
$minimum
[1] 0.09807912

$objective
[1] 8.321122e-06
Two lines. R is so sweet.
4 May 2007
Steal from motor vehicle
January 1997 to December 2006 - Steal from motor vehicle, Sydney Statistical Division
Statistically significant Downward trend over the 120 month period. The average annual percentage change was: -3.2%
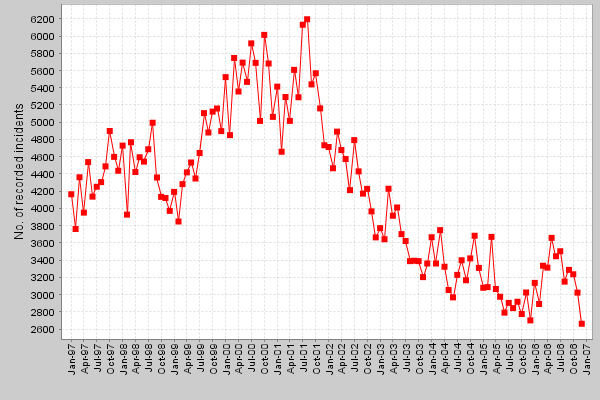
I found a brilliantly fun crime trends database that's part of the NSW Bureau of Crime Statistics and Research. Dad's car has been broken into 4 times in the last couple of years. It feels like he usually has a new window smashing story to tell most times I see him. They've all started to blur into each other.
But it made me curious to know why this keeps happening to him. We never used to have our cars robbed. My theory has always been that he should get a less fancy car. I know that mostly transfers the problem to other people, but I wouldn't mind if everyone got a less fancy car. If everyone stopped buying fancy cars and donated the money to training programs or mentoring programs or something, maybe there wouldn't be anyone around to rob their slightly less fancy cars. But I wasn't sure if it was just that. Perhaps there was a sudden epidemic of car theft all round Sydney.
Now I know. There hasn't been an epidemic. In fact things are looking rather rosy for the average car owner these days. Sadly, dad seems to be much less fortunate than the average car owner. I could probably work out how far out in the tails of the distribution he is. Must be pretty far I reckon.
19 April 2007
Death by truck flip
When I was in Cambodia I riding along on a motorcycle and I saw a truck that had driven off the side of the road and flipped over. The violence of it made me assume the driver had probably died, although it's possible he hadn't. There were people milling about and moving the cargo from the overturned truck to a number of other smaller vehicles.
I tend to think about the likelihood of various things happening when I'm overseas. I tried to work out the likelihood of being kidnapped in Colombia. I tried to work out the likelihood of my truck falling into the river on that hairy mountain trip from Peru to Bolivia. Or the likelihood of my five hours on a motorcycle containing a fatal accident. These things are hard to figure out. You can't really extrapolate from one event. I could look at the one month in Cambodia before the crash as a sample size of one. In that sample there was one bad car crash. Maybe that is a lot, but maybe it isn't. In one sense, it is definitely a lot, but it doesn't really tell you anything definitive about Cambodia. I have been in Australia my whole life, and have never seen a truck on it's back on the side of the road. How do I compare one crash in one month, to zero crashes in 24 years? You could multiply that one crash by the right proportion to have a guess at how many crashes there would be in 24 years. But you're not really supposed to.
Most people would look at that crash and get a bit worried. Statisticians would look at it and dismiss it because the sample size is too small. People are probably right to be worried, even though they don't have maths on their side. Although the only reason I think they're right to be worried is because I have a whole lot of other associations in my head about car crashes and third world countries.
If I try to ignore all the other associations there probably aren't any useful conclusions I could have made about that one bad crash. So when I saw another bad crash a couple of days later I felt a bit more confident. Two deadly crashes in four days had to mean something. Surely my fears were concretely justified. But they still aren't. Two crashes, even in one day, doesn't really count for anything. Statistically speaking, I reckon I'd have to spend many months on the backs of motorcycles scouting around for truck crashes before I could be confident about anything.
It all does make me wonder how much more likely statisticians are to die in violent crashes. Someone should do a paper on that. I'm obviously not very good at statistics, so I'd probably stuff it up.
23 March 2007
Parental Employment in 2004
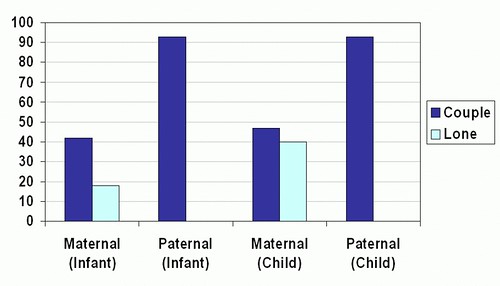
This is the sort of graph that makes me sad. I used it in a presentation last year and I was just looking back through it.
Single mother families are only ones that start going back to work as their kids grow up. Mothers with partners don't start working, although the number of married mothers working when their children are young starts out very high.
I think at least one parent should stay at home. Preferably two. That's probably why I like farms. Everyone's always at home.
Preventing Chronic Disease
This is a fascinating collection of statistics and graphs. I suspect even people who mostly find my blog boring with find this page fun. It shows how children's exercise patterns have changed since the 1970s. And it has some super nifty graphs of the change in calorie intake.
Apparently, the amount of activity American kids do has stayed fairly similar. Energy intake has increased by a tiny amount, but it's not statistically significant.
Fat mums make fat babies
A mother's weight during her pregnancy may have a lasting impact on her child's health. British researchers found that women who had a relatively high percentage of body fat tended to have fatter babies, and other studies have linked an overly high birth weight to an increased risk of obesity later in life. Doctors advise mothers to be to exercise regularly and to maintain a healthy weight through a balanced diet before and during pregnancy.
Obesity During Pregnancy Has Lasting Effect on Babies
Presumably it's also important to maintain a healthy weight after pregnancy.
I should add that I'm inclined to think that this is bollocks. I can't think of a way you could work out if this was actually true without force-feeding mothers. Newspapers are so crap.
26 May 2006
Distincion Alto
I did real good in my statistics mid-session. I used a whole A4 page to get one question completely wrong. But he gave me half marks "for the effort". Professors are the best.
Update: I ended up doing pretty well in my tutorial assignments. I got 75. So I need to get about 90 in my final exam to get an HD.
Maximum Likelihood
I just did my first one by hand. I felt very proud. It was a gamma distribution too, which always confuse me.
18 May 2006
Statistics is so cool
Statistics is so snifty. I don't understand most of it, but when I do understand a piece of it I'm always so impressed which how clever those old boys were. And I figure that if the easy stuff is this great, then the complex stuff (which I'll never understand) must be simply amazing. Maybe when they invent brain transfers I'll be able to see just how amazing.